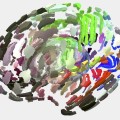
Personally, unless I concentrate on something other than her face, I see her bouncing from left to right and back again. I assume the effect is related to how our brains perceive faces: we’re much more accustomed to seeing faces from the front as opposed to from behind (as from the inside of a mask), and so when both interpretations are possible our brain strongly favours the natural, front-on view. (It’s a similar effect that of faces carved into a surfaces in counter-relief; the face appears to follow you as you move.) For me, the effect of this illusion is much stronger than that of the spinning ballerina, probably because of the facial element.
The source of this illusion is a mystery; despite extensive searching I was only able to find others (including Kottke) sharing the image, but not who created it. If you know who should be credited, please let me know in the comments.
That’s all from us at the blog this week. Have a good weekend, and we’ll see you back here on Monday!
Read more →


Recent Comments