Blog Category 1

A Serious Look at 10 Big Data V’s

ibm-big-data

So, what are the V’s representing big data’s biggest challenges? I list below ten (including Doug Laney’s initial 3 V’s) that I have encountered and/or contributed. These V-based characterizations represent ten different challenges associated with the main tasks involving big data (as mentioned earlier: capture, cleaning, curation, integration, storage, processing, indexing, search, sharing, transfer, mining, analysis, and visualization).

  1. Volume: = lots of data (which I have labeled a “Tonnabytes”, to suggest that the actual numerical scale at which the data volume becomes challenging in a particular setting is domain-specific, but we all agree that we are now dealing with a “ton of bytes”).
  2. Variety: = complexity, thousands or more features per data item, the curse of dimensionality, combinatorial explosion, many data types, and many data formats.
  3. Velocity: = high rate of data and information flowing into and out of our systems, real-time, incoming!
  4. Veracity: = necessary and sufficient data to test many different hypotheses, vast training samples for rich micro-scale model-building and model validation, micro-grained “truth” about every object in your data collection, thereby empowering “whole-population analytics”.
  5. Validity: = data quality, governance, master data management (MDM) on massive, diverse, distributed, heterogeneous, “unclean” data collections.
  6. Value: = the all-important V, characterizing the business value, ROI, and potential of big data to transform your organization from top to bottom (including the bottom line).
  7. Variability: = dynamic, evolving, spatiotemporal data, time series, seasonal, and any other type of non-static behavior in your data sources, customers, objects of study, etc.
  8. Venue: = distributed, heterogeneous data from multiple platforms, from different owners’ systems, with different access and formatting requirements, private vs. public cloud.
  9. Vocabulary: = schema, data models, semantics, ontologies, taxonomies, and other content- and context-based metadata that describe the data’s structure, syntax, content, and provenance.
  10. Vagueness: = confusion over the meaning of big data (Is it Hadoop? Is it something that we’ve always had? What’s new about it? What are the tools? Which tools should I use? etc.) Note: I give credit here to Venkat Krishnamurthy (Director of Product Management at YarcData) for introducing this new “V” at the Big Data Innovation Summit in Santa Clara on June 9, 2014.

Google is transforming Japanese business

tokyo-region-ga.width-1000

Google invited 13000 programmers and to its largest Asia pacific cloud event.

Google Cloud Next Tokyo. During this event, we celebrated the many ways that Japanese companies such as Kewpie, Sony (and even cucumber farmers) have transformed and scaled their businesses using Google Cloud.

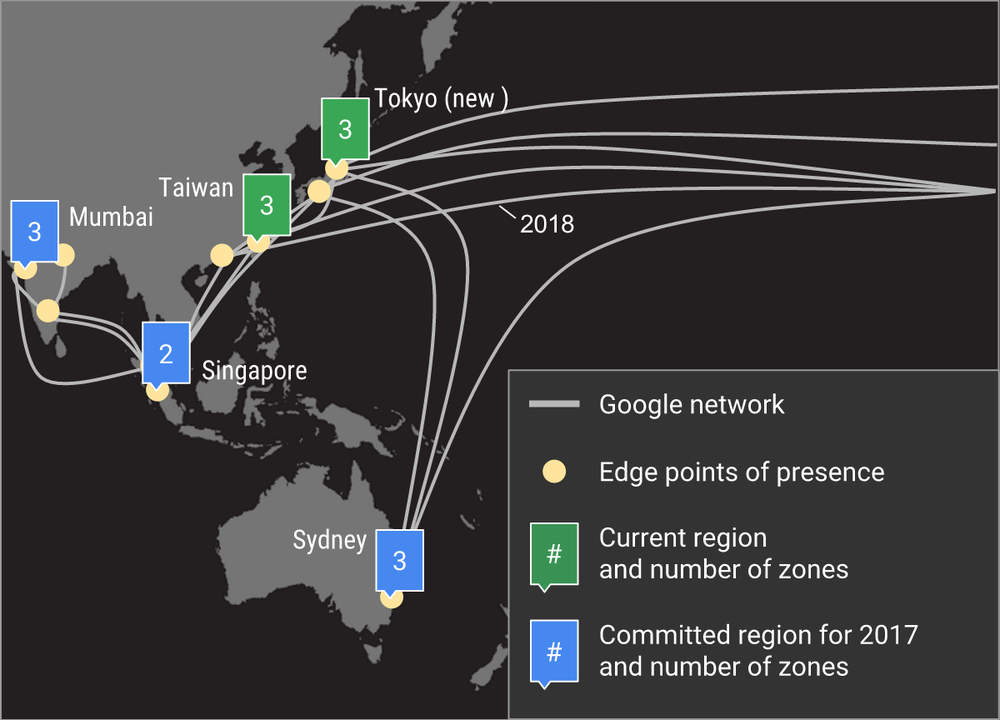
Since the launch of the Google Cloud Tokyo region last November, roughly 40 percent of Google Compute Engine core hour usage in Tokyo is from customers new to Google Cloud Platform (GCP). The number of new customers using Compute Engine has increased by an average of 21 percent monthly over the last three months, and the total number of paid customers in Japan has increased by 70 percent over the last year.

By supplying compliance statements and documents for FISC — an important Japanese compliance standard — for both GCP and G Suite, we’re making it easier to do business with Google Cloud in Japan.

Here are a few of the exciting announcements that came out of Next Tokyo:

Retailers embracing enterprise innovation

One of the biggest retailers in Japan, FamilyMart, will work with Google’s Professional Services Organization to transform the way it works, reform its store operations, and build a retail model for the next generation. FamilyMart is using G Suite to facilitate a collaborative culture and transform its business to embrace an ever-changing landscape. Furthermore, it plans to use big data analysis and machine learning to develop new ways of managing store operations. The project, — dubbed “Famima 10x” — kicks off by introducing G Suite to facilitate a more flexible work style and encourage a more collaborative, innovative culture.

Modernizing food production with cloud computing, data analytics and machine learning

Kewpie, a major food manufacturer in Japan famous for their mayonnaise, takes high standards of food production seriously. For its baby food, it used to depend on human eyes to evaluate 4 – 5 tons of food materials daily, per factory, to root out bad potato cubes — a labor-intensive task that required intense focus on the production line. But over the course of six months, Kewpie has tested CloudMachine Learning Engine and TensorFlow to help identify the bad cubes. The results of the tests were so successful that Kewpie adopted the technology.

Empowering employees to conduct effective data analysis

Sony Network Communications Inc. is a division of Sony Group that develops and operates cloud services and applications for Sony group companies. It converted from Hive/Hadoop to BigQuery and established a data analysis platform based on BigQuery, called Private Data Management Platform. This not only reduces data preparation and maintenance costs, but also allows a wide range of employees — from data scientists to those who are only familiar with SQL — to conduct effective data analysis, which in turn made its data-driven business more productive than before.

Collaborating with partners

During Next Tokyo, we announced five new Japanese partners that will help Google Cloud better serve customers.

  • NTT Communications Corporation is a respected Japanese cloud solution provider and new Google Cloud partner that helps enterprises worldwide optimize their information and communications technology environments. GCP will connect with NTT Communications’ Enterprise Cloud, and NTT Communications plans to develop new services utilizing Google Cloud’s big data analysis and machine intelligence solutions. NTT Communications will use both G Suite and GCP to run its own business and will use its experiences to help both Japanese and international enterprises.
  • KDDI is already a key partner for G Suite and Chrome devices and will offer GCP to the Japanese market this summer, in addition to an expanded networking partnership.
  • Softbank has been a G Suite partner since 2011 and will expand the collaboration with Google Cloud to include solutions utilizing GCP in its offerings. As part of the collaboration, Softbank plans to link GCP with its own “White Cloud” service in addition to promoting next-generation workplaces with G Suite.
  • SORACOM, which uses cellular and LoRaWAN networks to provide connectivity for IoT devices, announced two new integrations with GCP. SORACOM Beam, its data transfer support service, now supports Google Cloud IoT Core, and SORACOM Funnel, its cloud resource adapter service, enables constrained devices to send messages to Google Cloud Pub/Sub. This means that a small, battery-powered sensor can keep sending data to GCP by LoRaWAN for months, for example.

Create Cloud Spanner instances in Tokyo

Cloud Spanner is the world’s first horizontally-scalable and strongly-consistent relational database service. It became generally available in May, delivering long-term value for our customers with mission-critical applications in the cloud, including customer authentication systems, business-transaction and inventory-management systems, and high-volume media systems that require low latency and high throughput. Starting today, customers can store data and create Spanner instances directly in our Tokyo region.

Jamboard coming to Japan in 2018

At Next Tokyo, businesses discussed how they can use technology to improve productivity, and make it easier for employees to work together. Jamboard, a digital whiteboard designed specifically for the cloud, allows employees to sketch their ideas whiteboard-style on a brilliant 4k display, and drop images, add notes and pull things directly from the web while they collaborate with team members from anywhere. This week, we announced that Jamboard will be generally available in Japan in 2018.

Why Japanese companies are choosing Google Cloud

For Kewpie, Sony and FamilyMart, Google’s track record building secure infrastructure all over the world was an important consideration for their move to Google Cloud. From energy-efficient data centers to custom servers to custom networking gear to a software-defined global backbone to specialized ASICs for machine learning, Google has been living cloud at scale for more than 15 years—and we bring all of it to bear in Google Cloud.

We hope to see many of you as we go on the road to meet with customers and partners, and encourage you to learn more about upcoming Google Cloud events.

2 Key Lessons From Facebook’s Video Views Metrics Fiasco Read more: 2 Key Lessons From Facebook’s Video Views Metrics Fiasco – Digital Marketing and Analytics by Anil Batra

facebook-video-views


2 Key Lessons From Facebook’s Video Views Metrics Fiasco

People have short term memory (or selective memory), when they can’t remember things they will resort to how they think something should be. Recently Facebook was in the hot seat because of this very reason.

Facebook metrics definition issue

Facebook has a metrics called “Video View” for video ads.  In this metric they only counted the video as viewed if it was watched more than 3 seconds by the viewer.  In other words, if someone watches a video for 2 seconds then that video view won’t be counted as a view in this metric.

Facebook also has another metrics, called “Average duration of Video views”, the “standard” definition of it should be Total Time spent watching video divided by Total Viewers. However, that’s not how Facebook defined it.  In Sept Wall Street Journal reported that Facebook “vastly overestimated average viewing time for video ads on its platform for two years.”  This lead to an apology from Facebook

About a month ago, we found an error in the way we calculate one of the video metrics on our dashboard – average duration of video viewed. The metric should have reflected the total time spent watching a video divided by the total number of people who played the video. But it didn’t – it reflected the total time spent watching a video divided by only the number of “views” of a video (that is, when the video was watched for three or more seconds). And so the miscalculation overstated this metric. While this is only one of the many metrics marketers look at, we take any mistake seriously.

As per DM News article, Facebook did state the definition when it rolled out this metric two years ago.  So it was not actually doing anything wrong.  It was a case of short term memory issue.

“The problem, as critics put it, is a problem of omission. While Facebook very clearly states that it’s only counting views as any video-play event that lasts longer than three seconds, it does not go out of its way to explicitly beat readers over the head with the fact that this definition of a “video view” applies equally to the calculation of average duration of video views.”

If Facebook product team had read my posts from 2012 on “Creating a culture of analytics” then they might have likely avoided this “scandal”. The two issues that Facebook dealt with were the exact same ones I talked about in my posts. To recap, here are the gist of those two posts:

Lack of standard definitions for the metrics causes people to report different numbers for supposedly same metrics, leading to confusion and total lack of trust in data.  No trust in data means that nobody is going to use the data to make strategic decisions and there goes all your efforts to create a culture of Analytics.

Having standard definitions is not as easy as it sounds.  It starts from you and your team having a clear understanding on how to calculate various metrics.   Some seemingly simple metrics can be calculated in various different ways and all of those ways might be right but getting one standard way of calculating those removes any confusion and gets everybody on the same page.

  • People have short term memory.  In my 2012 post, titled  Dealing with Short-Term Memory: Creating a Culture of Analytics,  I wrote:We all make assumptions from time to time; sometime we state them clearly and sometimes we just assume in our own head. We then operate under those assumptions.  In context of Analytics, one such assumption is that everybody knows what the goals and KPIs are.  We might have defined them on the onset of the program, campaign, beginning of month, quarter, year etc., but once those are defined we start to assume that everybody knows about them and is operating keeping those goals in mind.

    Well the truth is that people have short term memory. They do forget and then start to interpret the KPIs, defined based on those goals, in their own way.  As the Analytics head/analyst/manager, it is your job to constantly remind stakeholders of the goals and KPIs.

Two Lessons

This fiasco provides two great lesson for all the Digital Analytics teams.

  1. Clearly define your metrics and make sure the underlying metrics and calculations are clear in your definition.
  2. Don’t make any assumptions, people have short term memory. Just because you stated a definition of a KPI in past does not mean everybody will remember it and know how tit was calculated. It is your job to make sure anybody using your metrics/KPI can get to the definition and calculations right away.


Page 2 of 3123

BLOG POSTS

ADDRESS

650 Parliament Street, Toronto,Ontraio, Canada
Phone: (416) 939-0044
Fax: (647) 720-2214
Website: http://www.datajadoo.com
Email: info@datajadoo.com

DISCLAIMER

Important:: This site has been setup purely for showcasing the analytic's skills of Data Jadoo. All the content are designed by Data Jadoo. Author retains his or her views on the topics expressed here. All images are copyrighted to their respective creators.